
Diversity
Royal A-ware believes that a diverse workplace provides a wide range of talent, skills, experiences and perspectives, fostering greater creativity and innovation. We are committed to creating a safe and inclusive work environment that promotes inclusivity and gender diversity. In line with this, we aim to increase the representation of women in senior management and in the Supervisory Board.
Impacts, risks and opportunities
As part of our DMA, we identified the following material IROs related to diversity:
Impact
A potential negative impact on employee well-being due to the lack of a policy and vision on diversity and an employee base that does not sufficiently reflect society.
Opportunities
-
A diversity policy and diverse workforce could help us attract employees and knowledge.
-
Workforce diversity leads to a broader range of perspectives, which could enhance our decision-making.
Our approach
As part of our commitment to creating a safe and inclusive work environment, we enforce a policy against discrimination and a policy to promote gender diversity.
Diversity policy
The diversity policy of Royal A-ware currently only focuses on gender diversity. The scope of this policy and associated targets encompasses our dairy and transport activities and covers our own employees and our Supervisory Board. The most senior manager accountable for the implementation of this policy is the HR Director of Royal A-ware and the Managing Director of AB Texel.
'We believe that a diverse workplace fosters greater creativity and innovation.'
Anti-discrimination policy
Royal A-ware upholds a zero-tolerance policy against discrimination and intimidation in all forms. This includes, but is not limited to, discrimination based on race, ethnicity, skin colour, gender, sexual orientation, gender identity, disability, age, religion, political beliefs, national or social origin, or any other grounds covered under European Union and national legislation. Our anti-discrimination policy aligns with the principles outlined in the United Nations Human Rights Convention.
Our DMA indicates that no specific groups of employees within the organisation are at an increased risk of discrimination. There are also no groups within our own workforce that are vulnerable to impacts and/or marginalised (for example, women, migrants, people with disabilities). Consequently, no targeted policies have been developed in this regard.
The availability of a complaints mechanisms and confidential advisors enables us to take immediate action if incidents of discrimination come to light.
Objectives and actions
Royal A-ware aims for a diverse workplace that reflects society, bringing together different backgrounds, skills, experiences and perspectives. Gender diversity is a particular area of focus.
Targets and achievements
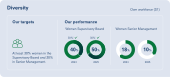
In response to the Growth Quota and Targets Act, Royal A-ware has established a clear target to increase the representation of women in senior management and in the Supervisory Board, demonstrating its commitment to gender equality in the workplace. Should progress toward this goal prove to be insufficient, we will introduce specific policies to further support and accelerate these efforts.
The target of 30% was already achieved in 2024 but was in 2025 was even higher (50%) with the appointment of another female supervisory board member. The target for the senior management (also 30%) was not in reach with 10%.
Other information
|
Number of employees by gender |
2025 |
2024 |
Unit |
|---|---|---|---|
|
Male |
4381 |
4038 |
Head count |
|
Female |
987 |
807 |
Head count |
|
Other |
0 |
0 |
Head count |
|
Not reported |
0 |
0 |
Head count |
|
Total number of Employees |
5368 |
4845 |
Head count |
|
Number of employees in countries with 50 or more employees representing at least 10% of its total number of employees (Country Level) |
Average number of employees 2025 |
Average number of employees 2024 |
Unit |
|---|---|---|---|
|
The Netherlands |
3778.5 |
3547.5 |
Head count |
|
Belgium |
459.0 |
341.5 |
Head count |
|
Germany |
501.0 |
498.5 |
Head count |
|
France |
117.5 |
91.0 |
Head count |
|
UK |
205.0 |
169.5 |
Head count |
|
Spain |
45.5 |
0.0 |
Head count |
|
Total number of Employees |
5106.5 |
4648 |
Head count |
|
2025 |
2024 |
||||||
|---|---|---|---|---|---|---|---|
|
Information on employees by contract type and gender |
Male |
Female |
Other |
Male |
Female |
Other |
Unit |
|
Contract type |
|||||||
|
Permanent employees |
3438 |
724 |
0 |
3226 |
599 |
0 |
FTE |
|
Temporary employees |
602 |
141 |
0 |
514 |
114 |
0 |
FTE |
|
Non-guaranteed hours employees |
0 |
0 |
0 |
0 |
0 |
0 |
FTE |
|
Total number of Employees |
4040 |
865 |
0 |
3740 |
713 |
0 |
FTE |
|
Full-time or part-time employees |
|||||||
|
Number of full-time employees |
3668 |
582 |
3487 |
491 |
0 |
FTE |
|
|
Number of part-time employees |
372 |
283 |
253 |
222 |
0 |
FTE |
|
|
Total number of Employees |
4040 |
865 |
0 |
3740 |
713 |
0 |
FTE |
|
2025 |
2024 |
|||||||||||||
|---|---|---|---|---|---|---|---|---|---|---|---|---|---|---|
|
Type of contract per region |
The Netherlands |
Belgium |
Germany |
France |
UK |
Spain |
The Netherlands |
Belgium |
Germany |
France |
UK |
Spain |
Unit |
|
|
Contract type |
||||||||||||||
|
Permanent employees |
2894 |
500 |
377 |
109 |
190 |
91 |
2779 |
321 |
432 |
111 |
182 |
0 |
FTE |
|
|
Temporary employees |
623 |
20 |
91 |
9 |
0 |
0 |
539 |
5 |
78 |
6 |
0 |
0 |
FTE |
|
|
Non-guaranteed hours employees |
0 |
0 |
0 |
0 |
0 |
0 |
0 |
0 |
0 |
0 |
0 |
0 |
FTE |
|
|
Total number of Employees |
3517 |
520 |
468 |
118 |
190 |
91 |
3318 |
326 |
510 |
117 |
182 |
0 |
FTE |
|
|
Full-time or part-time employees |
||||||||||||||
|
Number of full-time employees |
3001 |
440 |
461 |
117 |
141 |
91 |
2890 |
287 |
506 |
116 |
180 |
0 |
FTE |
|
|
Number of part-time employees |
516 |
80 |
7 |
1 |
49 |
0 |
428 |
39 |
4 |
1 |
2 |
0 |
FTE |
|
|
Total number of Employees |
3517 |
520 |
468 |
118 |
190 |
91 |
3318 |
326 |
510 |
117 |
182 |
0 |
FTE |
|
|
The total number of employees who have left the undertaking during the reporting period and the rate of employee turnover in the reporting period |
2025 |
2024 |
Unit |
|---|---|---|---|
|
Voluntary |
598 |
464 |
Head count |
|
Dismissal |
352 |
286 |
Head count |
|
Retirement |
69 |
54 |
Head count |
|
Death |
9 |
12 |
Head count |
|
Cause unknown |
10 |
21 |
Head count |
|
Total |
1038 |
837 |
Head count |
|
Head Count beginning of period 31/12/2024 |
4845 |
4447 |
|
|
Head Count end of period 31/12/2025 |
5368 |
4845 |
|
|
Average Head Count |
5107 |
4648 |
|
|
Turnover Rate |
20% |
18% |
|
The distribution of employees by age group |
31-12-2025 |
Percentage |
31-12-2024 |
Percentage |
Unit |
|---|---|---|---|---|---|
|
under 30 years old |
683 |
13% |
611 |
13% |
Head count |
|
30-50 years old |
2516 |
47% |
2387 |
49% |
Head count |
|
over 50 years old |
2169 |
40% |
1847 |
38% |
Head count |
|
Total |
5368 |
100% |
4845 |
100% |
Head count/percentage |
|
Number of non-employees in own workforce |
Head Count |
|---|---|
|
Self-employed people |
80 |
|
People provided by undertakings primarily engaged in employment activities (NACE Code N78) |
1769 |
|
Total number of non-employees |
1849 |
|
Collective bargaining (CLA) coverage Dairy NL + AB Texel * |
Collective bargaining |
Percentage (coverage) |
|---|---|---|
|
12/31/2025 |
12/31/2025 |
|
|
The Netherlands CLA |
3893 |
100% |
|
The Netherlands without CLA |
0 |
0% |
|
Total the Netherlands |
3893 |
100% |
|
Social dialogue * |
|
|---|---|
|
Country |
Coverage |
|
The Netherlands |
100% |
* The coverage as disclosed in the tables above relates to entities in the Netherlands, a phased‑in model is applied here, in which the Netherlands is the first country which is being reporting on.
